• 开源镜像
  • 开源沙龙
  • 媛宝
  • 猿帅
  • 注册
  • 登录
  • 息壤开源生活方式平台
  • 加入我们

开源日报

  • 2018年6月26日:开源日报第110期

    26 6 月, 2018

    每天推荐一个 GitHub 优质开源项目和一篇精选英文科技或编程文章原文,欢迎关注开源日报。交流QQ群:202790710;微博:https://weibo.com/openingsource;电报群 https://t.me/OpeningSourceOrg


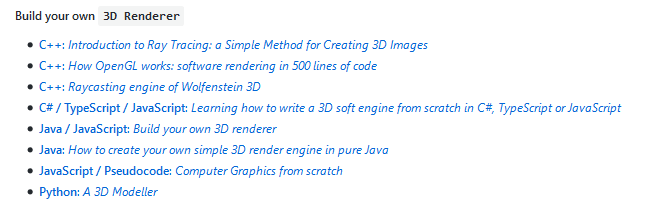
    今日推荐开源项目:《我不造故不解 build-your-own-x》GitHub链接

    推荐理由:这个项目收集了制作各种东西的方法……游戏,编辑器,搜索引擎,神经网络,各种各样。如果你对制作它们中的某个或者某些感兴趣,那么你找对地方了,这个项目里收集的各种教程总有一个会帮上你的。


    今日推荐英文原文:《10 Best Math Libraries for Python》作者:Mats Tage Axelsson

    原文链接:https://linuxhint.com/10_best_math_libraries_python/

    推荐理由:如果你需要解决数学问题就要有数学相关的库,这里就介绍了 Python 里面你可能用得到的数学库。

    10 Best Math Libraries for Python

    Many times, when you write programs you need to use special functions that others have used before you. When this happens, open source comes to the rescue and gives you a library that covers that need. Python calls theirs modules, to use modules you need to import them.Modules for mathematics are especially useful when you have the theory ready but need to use standard math for your particular problem.  The Mathematics module in the Python standard library has many features. It is useful to check if you can solve your problem easily with these functions. If you need to know what functions exist you need to go through the list. However, first realize that the module implements all the C standard functions.

    The simplest use of Python for math is as a calculator. To do this, start Python on the terminal and use the print function.

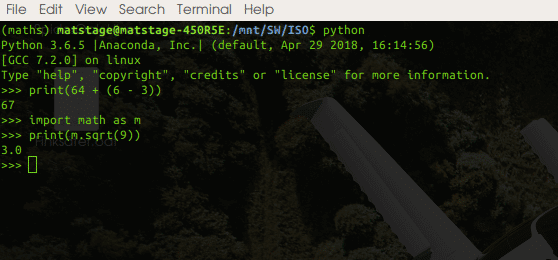
    The simple math is available without even activating the math module but beyond addition, subtraction, division and multiplication you need to import the math module. To make the code short, import as ‘m’. Now you put m and a dot in front of any functions you use. This works the same for all modules in Python. If you want to use complex numbers, use the cmath module.

    For functions beyond that, below are some libraries specialized for certain needs.

    1. The NumPy libraries handles the mathematical functions for arrays. Creating arrays of any type is possible and optimizing in memory is also supported. The N-dimensional array is fully covered. Functions that the library handles includes iteration, Fourier Transfom, linear algebra and financial functions. This library also implements a C-API so you can use the speed of C without translating your entire project.
    1. SciPy is a collection of science related software, with mathematical tasks at the center. If you need to calculate anything, this is a good place to start. The collection includes integration, optimization and sparse eigenvalues.
    1. Scikit-image is a great resource for manipulating and analysing images. The library has features for detecting lines, edges and features. It also has restoration features, for when you have images with defects on them. There are also many analysis tools available.
    1. Scikit-learn is useful for getting machine learning code together. It contains modules for classification, regression, clustering and more. The web page is full of useful examples so you can easily get started.
    1. Pandas is your goto resource for big data sets to do your data science on. Pandas supports data analysis and modeling and does it with simple and clear code. Many functions are translatable from R, so you can prototype with Pandas.
    1. Statsmodels covers your needs for statistical models. This library handles many similar things like Panda but can also import Sata files and handle time series analysis. There is a sandbox included where you can experiment with different statistical models. That particular code is not tested yet but maybe it is close enough for you to finish the job.
    1. Matplotlib: For plotting your graphs, includes animated plots.
      The earlier libraries are great for the mathematics but they have deliberately stayed away from plotting. Instead they let libraries like matplotlib handle these
      This has made matplotlib extensive and it also has many supporting software that covers mapping, plotting and electronic circuit design.
    1. Gnuplot.py is an interface package to the popular gnuplot program. It has an object oriented design so you can add your own extensions.
    1. Patsy describes statistical models in all its forms. It also has many functions that are common in R but with small differences, like how to denote exponentiation. Patsy will build matrices using formulas, very similar to the way it is done in S and R.
    1. Sympy: When you want to print your mathematical formulas you use this library. It also has the capability to evaluate expressions. It is very useful for creating formulas in your LaTeX documents. You can even run Sympy live in your browser to test it out.

    Now that you have learned what projects to use for mathematics you will soon be short on processing power. To remedy that situation parallel execution is the most common solution. There are several Python libraries for this purpose.

    The mpi4py library provides bindings to the standard Message Passing Interface. You need to download a standard parallel library like mpich or openmpi. Both are available in the standard repositories.

    The other library is parallel python or pp. Parallel Python creates a server and many clients that take jobs from your server. This project does not implement a standard, instead you use the server and client from this same package on all your machines. This is simpler in some ways but it requires more when your project becomes big and you need other people to lend you processing power.

    These libraries are all good in their own right but make sure to pick the correct one for your needs.
    The choice is not irreversible but will require quite a lot of work later in a project. Your source code will need to be changed to use a new library and new faults will occur so choose wisely.

    If you want to do your calculations interactively, install and use Ipython as this is an enhanced version of the command line version of Python. Also, if you have not already, consider using Jupyter. It provides you with notebook, documents and a code console on the same workspace.

    The framework acts as an IDE but is aimed more at exploring the problems and the software you are developing than traditional IDEs.


    每天推荐一个 GitHub 优质开源项目和一篇精选英文科技或编程文章原文,欢迎关注开源日报。交流QQ群:202790710;微博:https://weibo.com/openingsource;电报群 https://t.me/OpeningSourceOrg

  • 2018年6月25日:开源日报第109期

    25 6 月, 2018

    每天推荐一个 GitHub 优质开源项目和一篇精选英文科技或编程文章原文,欢迎关注开源日报。交流QQ群:202790710;微博:https://weibo.com/openingsource;电报群 https://t.me/OpeningSourceOrg


    今日推荐开源项目:《JScalibur WarriorJS》GitHub链接

    推荐理由:事先说明,这个当然不是真的圣剑什么的。这个项目是一个游戏,你要给你的战士……用JavaScript写出一个冒险指南,然后让你的战士一路爬塔过关。虽然这是个游戏,但是可以训练你的JavaScript基础能力,推荐准备学习JavaScript的朋友来试试。

    今日推荐英文原文:《Animated Graph in React Native》作者:Jiří Otáhal

    原文链接:https://medium.com/react-native-motion/animated-graph-in-react-native-51354af2bdb0

    推荐理由:一个动画可能不算太难,但是动画+图表呢?这篇文章就告诉你如何做出一个带有动画特效的图表

    Animated Graph in React Native

    Recently I was looking for a React Native graph library for my Pineapplee.io app. During the research, I realized it’s not easy to deal with graphs in React Native. And if you want to animate them? It looks almost impossible. The following gif is what I have done and will talk about in this “tutorial”!

    Goal of this article

    Without ART library

    When I was doing my research about charts in React Native, I found out that almost everyone uses the ART library. Which is really cool and powerful drawing library. Look at this pie chart that has been done by ART library for the Pineapplee.io app.

    ART library Pie Chart in pineapplee.io

    But when you want to animate it? Well, you can. It is possible. But the animation is done by JS thread. I am always trying to find a way how to move everything to a native part, so our JS thread is not blocked by animation and can work on something else.

    The column chart I am going to talk about (and you can see in the gif below) has been done by pure React Native. No ART library!

    Let’s make it a bit complicated

    I realized that I also need a negative value in the graph. Users of Pineapplee.io usually create a group for a trip and track their spendings. Obviously, there are only negative values — only spendings. The following gif shows how the animation looks like for both negative and positive values.

    Layout

    I decided to make every single column separately as a component. So I could add a “delay” effect. You can see that the animation starts randomly for every single column when the graph is changing a position of baseline. Let’s work with the 200 height. Value’s height could be 25 and label’s height 25 as well. That makes 150 for column.

    Layout for a single column

    If the graph’s height is 150 then the column’s height is 300. Every column has a positive part (A) and a negative part (B). Opposite side of these parts is always hidden. The A is hidden for the negative part and the B is hidden for the positive part. It means that if we move the positive part (A) underneath of baseline to the B space, the positive column will be completely hidden. That’s what we want when the value is negative.

    Positive parts of columns (left side) and negative parts of the same columns (right parts)

    You can see the negative value for the last column on the picture. The value is -5. Positive column is completely moved underneath of baseline (it’s hidden) and negative column is moved to proper Y position to represent -5 value. A maximum value for this graph is 10 (first column). It means that the -5 will be in the middle of a negative part (75 / 2).

    We need to do a bit of math here because we need to interpolate actual value to Y position. But I am not going to talk about this here. I believe that you can figure everything out pretty easily.

    Animated Column

    I used my open source library called react-native-motion and component TranslateY. Which makes animations really easy to implement. Look at the code. Easy to understand. We use TranslateY component in the same way as we would use View component. The only thing we need to do is compute Y positions for positive column, negative column, baseline, and a value label.

     <View style={styles.container}>
              <TranslateY
                style={[styles.graphContainer]}
                value={graphLayerY}
                delay={delay}
              >
                // Positive column
                <TranslateY
                  style={styles.positiveColumn}
                  value={positiveY}
                  delay={delay}
                />
                // Baseline
                // ...
                //
                // Negative column
                <TranslateY
                  style={styles.negativeColumn}
                  value={negativeY}
                  delay={delay}
                />
              </TranslateY>
              <TranslateY
                style={styles.valueLayer}
                value={valueLayerY}
                delay={delay + valueDelay}
              >
                {this.renderValue()}
              </TranslateY>
    </View>

    Check the result in a real application. Pineapplee.io already implemented the column chart. As I said before, everything is done by UI thread (it’s pretty fast). There is an onPress event so you can change the months. When you select the category it will change the values of a graph and recomputes Y positions. Then the react-native-motion takes care of animation.

    Animated Number

    The number animation is a bit problem. Because we can’t move it to UI thread. It has to be done by JS thread. I’ve seen that developers usually have the effect done by setInterval. Of course, you can use it, but I wanted to do it safer.

    So I use React Native’s Animated API even for the number animation. We can add a listener to animated value and when the value is changed we just re-render the number. It’s easy and you can take advantage of the Animated API. By using an Easing for example. And what’s the best? I put the component to the react-native-motion library which is open-sourced for you guys ?

    You just have to write a couple of lines like this. Once the value is changed in your code it will take care of the rest.

    Available in react-native-motion

    Did you like it? Clap, Follow and Animate it! ?

    Actually you don’t have to do anything of that. But it will help me a lot. It’s a big motivation for next articles like this.

    About me ?

    I am an author of Pineapplee.io (which I also use as a playground for my animations ?‍). And author of react-native-material-ui and react-native-motion libraries. Writing about them in this blog.


    每天推荐一个 GitHub 优质开源项目和一篇精选英文科技或编程文章原文,欢迎关注开源日报。交流QQ群:202790710;微博:https://weibo.com/openingsource;电报群 https://t.me/OpeningSourceOrg

  • 2018年6月24日:开源日报第108期

    24 6 月, 2018

    每天推荐一个 GitHub 优质开源项目和一篇精选英文科技或编程文章原文,欢迎关注开源日报。交流QQ群:202790710;微博:https://weibo.com/openingsource;电报群 https://t.me/OpeningSourceOrg


    今日推荐开源项目:《与其说古典风不如说古老 ClassicKit》GitHub链接

    推荐理由:这个项目是一套iOS组件,当然了,它古老就古老在它是Windows95风格的。当然了,虽然画风变老但是功能一样好用,它还是可以当作普通的组件去使用。这个作者最精妙的地方就在于他加了这么一个蓝屏的更新,可以说是相当还原了:

    (3/17) Added a simple Blue Screen of Death! Simply shake the device vigorously.


    今日推荐英文原文:《Zero Power Computing — How to Perform Calculations Using Zero Power》作者:Brandon Skerritt

    原文链接:https://hackernoon.com/zero-power-computing-how-to-perform-calculations-using-zero-power-e2b4bfcd4d7e

    推荐理由:这篇文章应该算是介绍一种魔法了……讲的是如何使用更节能的方法来进行计算,对,是节约能源那个节能,兴许这篇文章可能就是改变未来的基石也说不定。

    Zero Power Computing — How to Perform Calculations Using Zero Power

    Moore’s law is dying. There have been countless articles on this. We cannot keep on packing transistors into a given unit of space, expecting each time that the power of the CPU doubles every year.

    The smaller and smaller the chips are made, the more problems that are produced. To think this rule would last forever is naïve, we’re running out of space and it’s going to cause problems. Luckily there’s a storm brewing. It is theoretically possible to perform computations with zero power. This article will explain how that is possible.


    In the 1950s Computer Scientists wanted to know if it is possible to build an accurate simulation of classical physics. Not a “close to” simulation, but 100% accurate.

    Whilst working this problem, they discovered something interesting:

    Newton’s Laws of Physics are reversible

    Let’s say you see a ball from a basketballers hand in an alternate world. In this world, friction doesn’t exist. For the next few examples, remember that in this world friction doesn’t exist. The ball is dropped, bouncing off the ground to the same starting height it started at.

    Let’s put some arbitrary numbers on this now. Let’s say that the ball gains 6 units of energy to reach the floor.

    When the ball touches the floor, it goes back up again — using 6 units of energy.

    In this world of pure Newtonian physics, the laws are reversible.

    If we made a movie out of the ball falling; the ball would look the same going forwards in time as it would going backwards in time.

    Let’s see another example from this same world — taken from the book “Computing with Quantum Cats”.

    Let’s assume you have 2 balls of the same colour on a snooker table. One of the balls hits the other and you filmed this interaction. If you reversed the film it would make as much sense as it did going forward. If you presented this film to someone and asked them “Which ball hit the other ball?” they would not know the answer.


    Take a look at the ball below. We do not hold any information about how the ball got there, only that it is there. We don’t know whether it was placed, kicked, dropped or even teleported there.

    We don’t know whether the ball was dropped from 40ft or 50ft, we hold no information about this ball.

    From the last few examples we can see that there is an interesting link between information and energy.

    Although each individual action is reversible, if we add more balls it’s not reversible. Let’s say we take the snooker example from earlier, but this time we watch a break at the start of the game:

    We can always tell which one is the future and which one is the past. The future is the one with more disorder.

    As the second law of thermodynamics states:

    The amount of disorder in a system always increases and the result is not reversible.

    The term disorder is often called entropy. These rules of thermodynamics and entropy is useful to us since entropy is measured in information.

    What’s important to note here is that the relationship between thermodynamics, reversibility, and information are all based on the act of computation itself. Not the power required to run the computer or the power required to run the monitors.

    Rolf Landauer found out in 1961 whilst a researcher at IBM that some computation does not need to dissipate energy. He found out that computation and the physical reality are united. In his own words:

    “Information is not a disembodied abstract entity; it is always tied to a physical representation. It is represented by engraving on a stone tablet, a spin, a charge, a hole in a punched card, a mark on paper, or some other equivalent. This ties the handling of information to all the possibilities and restrictions of our real physical word.” — Rolf Landauer

    We have a connection between reversibility and thermodynamics. We have a connection between thermodynamics and information. Therefore we have a connection between reversibility and information.

    The author John Gribbin describes a fun thought experiment to better get an overall view of this thinking.

    Figure 1 — Image depicting a ball on a box with the number “0” under it. There is another box with the number “1” on it over a hill.

    The 0 and 1 here represent binary bits. The hill represents the physical aspect to toggling the binary bit. When the ball goes over the hill and down the other side, it’ll toggle the binary bit to be 1.

    When it does the reverse, it’ll toggle the binary bit to be 0.

    The ball traversing the hill would look like this:

    Figure 2- image depicting a ball going up one side of the hill using +6 energy and going down the other side of the hill using -6 energy. The ball eventually toggles the switch to 1.

    The ball gains an arbitrary amount of energy as it is pushed up the hill and it releases this energy going down the hill.

    It has, effectively, cost 0 energy to toggle the binary bit. This is an important statement. John Von Neumann once said “it costs energy to toggle a switch” but our little experiment has displayed that it it possible to not expend energy.

    Although it cost nothing to toggle the switch (moving the ball from one side to the other) it will cost something to check where the ball is. It will cost something to check what position the switch is in.

    The act of the computation itself can cost nothing, but everything else might cost something.

    Computers are entirely made up of toggles like this. If it costs nothing to toggle a simple switch like this, we can have entire circuit boards built up of gates that cost nothing.


    Gates

    Let’s take a look at some logic gates.

    A logic gate is a decision making tool. You give it some input and it gives out an output. One of the simpler logic gates is the AND gate.

    And gate taken from my post on logic gates, here

    Logic gates can only take 0 or 1 as input. The AND gate outputs the product of A and B. Or in other words, it only outputs 1 when A and B are 1.

    Truth table taken from my article here

    In all other instances when A and B are not both 1 the AND gate will output 0.

    If we come across an AND gate and the output is 1 — we know for sure that the 2 inputs were 1 and 1.

    If we come across an AND gate and the output is 0, we don’t know what the input was. It could of been A = 0, B = 1 or A = 1, B = 0 or A = 0, B = 0.

    We cannot reverse the AND gate to find out what the input is when the output is 0.

    A reversible computer has to be built out of logic gates that can be reversed. The AND gate is not a reversible logic gate so it is not useful here. To build a computer which can replicate classical physics the components of the computer have to be reversible too.


    Reversible Programs

    Charles Bennet in 1973, whilst working at IBM, created a few simple reversible computer programs. The first half would do the computations and the second half would undo the computations. In his words:

    “The first half would generate the desired answer … as well as typically, some other information … the second half would dispose of the extranous information by reversing the process that generated it but would keep the desired answer.

    This led me to believe that any computation could be rendered into this reversable format by accumulating a history of all information that would normally be thrown away, then disposing of this history by the reverse of the process that generated it. To prevent the reverse stage from destroying the desired output along with the undesired history, it suffices, before begginging the reverse stage, to copy the output on blank tape. Copying onto blank tape is already logically reversible.” — Charles Bennet

    Simply put the proces is as follows:

    • Compute the answer
    • Write the answer down somewhere
    • reverse all computations to get back to the original state

    Bennet’s work was purely theoretical. However, Ed Fredkin had designed a reversable logic gate to build a computer with.


    Fredkin Gates

    The Fredkin gate is a universal gate. Meaning that any logical or arthimetic instruction can be created using a Fredkin gate. Any logic circuit can be created using just Fredkin gates. This means that any computer can be made entirely out of Fredkin gates.

    If you are not so sure on logic and gates, check out this previous article I’ve written here.

    Image of a Fredkin gate from here

    Wikipedia has a nice explanation for how Fredkin gates work, copied here with slight changes.

    The Fredkin gate maps three inputs (A, B, C) onto three outputs (P, Q, R). The C input is mapped directly to the R output. If C = 0, no swap is performed; A maps to P and B maps to Q.

    Otherwise (if C = 1) the outputs are swapped. A maps to Q and B maps to P. C is always mapped to R.

    If this is run backwards, it undoes itself. If the output of this Fredkin gate is fed to the input of another Fredkin gate (P to A, Q to B, R to c) the output of the second Fredkin gate is the same as the input of the first Fredkin gate.


    Conclusion

    If we build a perfect Fredkin gate we will get zero power computation. Computing would no longer cost energy. This can change everything. Blockchain uses up enough energy to power a country. Imagine a blockchain that consumed next to 0 energy, the only limitations for it would be the memory problems.

    The battery life of a mobile phone would be 10x that of a phone today. The phone no longer has to waste power in computing things, the only power it wastes is keeping the screen on. But, there are always downsides to the upsides.

    The problem with building a reversible computer is that it’s hard. It requires us to completely shift our mindset away from everything we know. Computer Scienctists have always buitlt computers to consume electricity. Which have always been built using traditional logic gates. This is a quantum shift in not only our thinking but, fundamentally, how every single device on the planet should behave.

    It’s also a slow process. Although Fredkin gates can reverse and give us back the computational energy they can never give back time. What might take something 4 seconds on a CPU to compute would take 8 seconds on a Fredkin gate to compute. This is due to the fact that once you have computed it, you have to undo all the calculations — effectively 2 times the process.

    It’s also impossible as of yet. Throughout this article we have assumed that we live in a frictionless world, which isn’t very reasonable. It’s theoretically possible, but not much work has been done here.

    In the 1990s a research team discovered that the energy savings from a Fredkin gate are linearly proportional to how slowly you run them.

    In 2016 it was announced that researchers had created a quantum Fredkin gate which could be used to build a quantum computer. This is a quantum gate, so cannot be used in ordinary analogue computing. It’s one step closer to building computers which can perform zero power computations, but it’s still a long way off.


    每天推荐一个 GitHub 优质开源项目和一篇精选英文科技或编程文章原文,欢迎关注开源日报。交流QQ群:202790710;微博:https://weibo.com/openingsource;电报群 https://t.me/OpeningSourceOrg

  • 开源日报 App 发布,欢迎下载使用,每天十分钟,保持学习的好习惯

    24 6 月, 2018

    Update:该 App 暂时下架,准备新版中


    开源工场今天很高兴跟大家报告,进行到第108期开源日报的时候,我们的“开源日报”栏目终于推出了独立的 App,下载地址如下:

    • Google Play 地址:https://play.google.com/store/apps/details?id=org.openingsource.hackerchai
    • APK 下载地址:https://opensourcedaily.org/osd.apk

    欢迎喜爱开源和计算机编程艺术的小伙伴们下载使用!这是一个初版,可能不是很完善,但是背后有一群小伙伴还在不断地完善、给它增加新功能,如果你对开发 App 感兴趣,欢迎在电报群和QQ群联系 hackerchai 同学,一起来填坑!

    开源日报是一个旨在鼓励大家每天保持学习习惯的栏目,每天推荐一个 GitHub 优质开源项目和一篇精选编程或者科技文章英文原文。2018年2月28日试行创刊号第0期,然后3月9日正式开始第1期,每天一份,从未断线。

    设立“开源日报”这个栏目的初衷和目标是来自于一些感受,很多同学是通过 Linux 知道的开源,但是开源可是远远不止 Linux ,世界上其实非常多优质的项目都是开源项目,包括 GitHub 上、身边的朋友自己写的,一些公司或者基金会开发的,很多很多优秀,但是不够知名的开源项目每天都在发布和更新,开源的意义在创作、在协作、也在分享和学习。发现一个优质的开源项目,可以使用、参与,那种宝贵好比找到一个志同道合的朋友,欣喜难以言表;而且在这个信息发达的社会,你也不需要重复去造轮子,完全可以了解和学习更多更酷的开源项目,再在巨人的肩膀上把自己的事情做得更好!这是每天推荐一个优质开源项目的初衷。而”开源日报”的另一半内容——每天推荐一篇优质英文原文的想法是来自于另外一个痛点,大家都知道很多前沿技术或者技术文档都只有英文的,如果要保持学习的好习惯,阅读英文开源说是非常重要的一件事情了,所以我们希望通过这两部分内容,鼓励自己和喜欢开源的同学每天花十分钟,了解一个不太知名的开源项目,阅读一篇英文科技、编程原文,坚持一个月半年一年,一定会有成长。

    目前开源日报栏目的 PM 是 重庆大学软件学院大一的咪喵同学,开源日报 App 则是由重庆大学弘深学院大一的 hackerchai 同学编写,在此非常感谢迪峰和 hackerchai 同学滴辛勤付出,可能这也是开源精神之一,因为喜欢这件事情,就是做这件事情的原因和动力,如果我们喜欢做的事情对同样喜欢开源的你有帮助,那就更棒了!而我们一直在坚持用非盈利和学院派的风格来纯纯粹粹地做开源,不去物化一份喜爱,不去装饰一份质朴;保持纯粹和简单,保持热爱和平凡,我们觉得“热爱”这件事情本身是更值得珍惜的。

    开源工场的目标就是保持一个简单纯粹的原始的开源精神,并且要去守护和发扬这种黑客精神,它是一个通过开源协作形式来创造生产力和寓技术于乐趣的频分多址非盈利开源社区,主张享受开源审美和动手做开源。社区的运作以技术主持人为驱动,目前绝大部分成员都是在校学生,像“开源日报”、“开源周报”、“媛宝”等是我们推出的栏目,而人工智能、操作系统、Python 等编程语言,我们都在关注,“学生开源年会”也是开源工场的小伙伴主办的,如果你对开源工场感兴趣,认可想要更多的伙伴了解开源贡献开源,欢迎加入我们一起来发扬这份热爱。

    话说回来我们的 App,目前开源日报 App 的缺点主要是:

    • 由于服务器在美国和日本,内容加载速度不够快,但是看在开源日报封面那么好看的面子上,需要耐心等待3-5秒钟才能加载上,Nova 同学最近也在研究怎么加速服务器的访问,速度问题会在7月份左右得到解决。
    • 功能比较简单,目前主要的功能是查看每天的日报
    • 目前内文阅读用的是 webview,排版效果不够好

    低头说完缺点,大胆说说我们的优点:

    • 每日坚持更新,从未掉队。
    • 内容精挑细选,每天从上百个 RSS 源中挑选我们觉得合适的内容。
    • 封面美轮美奂,设计感十足,全部是小伙伴自己做图,大部分图片都可以直接做壁纸了。
    • 界面简洁,专注在内容上

    开源日报未来会增加这些功能,会在接下来的几个月陆续实现:

    • 评论及讨论功能
    • 用户管理系统,收藏文章,追踪关注的开源项目
    • 调整字体、背景颜色
    • 设置语言(简体中文、繁体中文)
    • 系统通知每日份开源日报
    • 重写界面,让阅读效果更棒

    如果有任何想法和建议,也欢迎加入电报群或者QQ群(我们更鼓励电报群,但是绝对不歧视QQ群)和我们一起交流。我们所有的联系方式都在这里:https://opensourcedaily.org/about/join/;今天发布的 App 是一个初版,可能不是很完善,但是背后有一群小伙伴还在不断地完善、给它增加新功能,如果你对开发 App 感兴趣,欢迎在电报群和QQ群联系 hackerchai 同学,一起来填坑!

    软件界面截图:

    关于界面:

    侧边栏:

    正在填坑的同学:尤其是 hackerchai 同学(开发)、Haochen和glodxy(设计)、咪喵(日报 PM)、琳洁(开源工场设计师)


    好了,介绍到这里,虽然这个 App 现在功能还不多,你想来试试吗?查看下载地址:

    • Google Play 地址:https://play.google.com/store/apps/details?id=org.openingsource.hackerchai
    • APK 下载地址:https://opensourcedaily.org/osd.apk

    欢迎热爱开源的你跟我们一起保持每天学习的好习惯。

←上一页
1 … 232 233 234 235 236 … 262
下一页→

Proudly powered by WordPress