• 开源镜像
  • 开源沙龙
  • 媛宝
  • 猿帅
  • 注册
  • 登录
  • 息壤开源生活方式平台
  • 加入我们

开源日报

  • 2018年9月25日:开源日报第201期

    25 9 月, 2018

    每天推荐一个 GitHub 优质开源项目和一篇精选英文科技或编程文章原文,欢迎关注开源日报。交流QQ群:202790710;微博:https://weibo.com/openingsource;电报群 https://t.me/OpeningSourceOrg


    今日推荐开源项目:《如果 bash 里有对象了 Bash Infinity》传送门:GitHub链接

    推荐理由:大家都知道 bash 是什么,但是如果把 bash 和面向对象这些特性混合起来,那它还是 bash 吗?当然是,这个项目就是试着为 bash 引入了诸如面向对象这些特性的框架,作者希望能够让 bash 脚本拥有现代编程语言的诸如可读性的这些特点,有兴趣的朋友可以来看看,兴许以后第一个 bash 库就会从这里诞生也说不定。


    今日推荐英文原文:《Javascript, the bad parts, and how to avoid them》作者:Anthony Cyrille

    原文链接:https://medium.com/@Rewieer/javascript-the-bad-parts-and-how-to-avoid-them-1a7c9bc5a0dd

    推荐理由:JS 不好的地方以及如何避免它们,直到我看到这篇文章之前,我都不敢相信有0.1+0.2=0.300000000004这种操作

    Javascript, the bad parts, and how to avoid them

    I’ve started getting real with Javascript by October 2016. I started by reading some great books :

    • JS : The Good Parts
    • Eloquent Javascript
    • Building Javascript Applications
    • Javascript Design Patterns

    And really, I loved it. I understand why Javascript gained so much in popularity :

    • It’s the de-facto programming language for client-code running in the browser
    • Since around 2009, it can be used as a server programming language, so using one language through the whole codebase is a huge plus
    • It’s dynamic, event-driven, uses an event-loop in a single-thread, which reduces concurrent programming complexity a lot
    • It has an elegant syntax, mostly because it provides functions as first-class citizens (read : your functions can be arguments and returned values as much as any variable, or any literal) and closures (a way to point to variables, even through they are out of the function itself), which enables a lot of great way to build composable code
    • It’s prototype-oriented (rather than class-oriented like Java or C++)

    The biggest thing to me about Javascript is how light it is to write code. Remember how hard it was to declare and manipulate an array in C ? Remember how rigid are C structures ? In Javascript, you have literals, and much of the complexity is managed by the engine, so you’ll never have to deal with it.

    This is great, because you can really focus on your product. You can declare an Array on the spot using literals and fill it with anything. You don’t care whether it’s a List, a Vector, or even a HashTable indexed by numbers (why not ? since Arrays are just objects with numerical indexes, erm, string numbers actually, this might actually make sense). Hopefully you’ll never have to know, and people seems happy with it.

    Sadly, this design is what gives Javascript a lot of bad parts. Let’s cover them.

    Types

    Sadly, and probably the worst choice ever made about JS, is that it’s weakly typed. Variables are untyped, only values are, and what types are they ? It’s either Object, Symbol, String, Number, Boolean, Null (yeah), and Undefined (yeah, undefined is a type of his own). What’s even kind of ridiculous is that when you test that your variable is an object, you have to do this :

    if (typeof myObject === "object" && myObject !== null)

    Because your object can be of type Object, and still be null you know.
    And this weakly thing really is a pain because without types, the code is damn obscure.

    How to fix : That’s where people started using TypeScript and FlowType. Adding type to Javascript is like adding chantilly on top of your chocolat ice-cream. It makes it so good you wont ever eat chocolat ice-cream alone, EVER.

    Numbers

    It’s terrible that numbers in javascript are double-precision floating points (i’ll talk about it in an article dedicated to representations). Which means you have no integer type. What’s the problem with it ? Just watch.

    For god sake

    Yeah, 0.1 + 0.2 is equal to 0.300…4. And well, this is terrible when you want to check 0.1 + 0.2 === 0.3 because, in JS, it turns out it isn’t.

    Once again, to explain this, i’ll have to talk a lot about how floating numbers are represented in a computer, so for now just know this is barely the type of the icerberg.

    How to fix : well this isn’t a bug per se, it’s just by design. You can work it out by using an other library, such as decimal.js

    Coercion

    The most painful topic about JS is coercion.

    What is coercion ? Recall that JS has native types (Number, String…) and that variables are not typed, values are. When you do typeof myVar === "number" you are actually looking to know if the type of the value myVar is pointing to is a number. It’s important to understand that.

    let myVar = 10; // typeof myVar === "number"
    myVar = "Hello World!"; // typeof myVar === "string

    Now, what happens when you want to do an operation with two variables, whose values are different types ?

    let a = 10;
    let b = "10";
    let c = a + b; // ???

    A decimal 10 is represented differently than a string 10. For example, the number 10 could be represented in 8 bits as 00001010. The string 10, is encoded using two ASCII characters* : 00110000 (48) and 00110001 (49).

    In order to do proper calculation, the Javascript Engine must ensure both operands are of the same type. And JS tries to do the best for you, so in this case it will assume you just want to concatenate a decimal 10 to a string 10, and returns a string value of “1010”.

    Why, thanks you JS

    As I said before, because most of the implementation choices are done for you in the JS world, you have to be very careful. And you know where this might hurt you the most ?

    User Inputs.

    Imagine an user enters an amount he wants to invest for, let’s say, roulette. Because you are rude, you want to take a 1€ fee, so you naively do the following :

    let totalCost = 1 + moneyInvested

    The afternoon, you receive a message call about how a bastard you are that he wanted to invest 100€ but you actually took 1100€. Good luck with that.

    How to fix : in order to avoid letting JS do the coercion job for you, you have to convert types yourself.

    • To convert a String to a number, go with parseInt
    • To convert a String to a float, go with parseFloat
    • To convert a Number to a string, use the .toString() method like (54).toString() (yeah that’s funny how native types all are Objects)
    • To convert a String to a Boolean, there’s no magic, you do var myBoolean = myString === "true";

    Be mostly careful about coercion when it comes to condition and loops. It will bite you. Read this article for more in-depths about it.

    Callback hell

    To know this has been a thing…

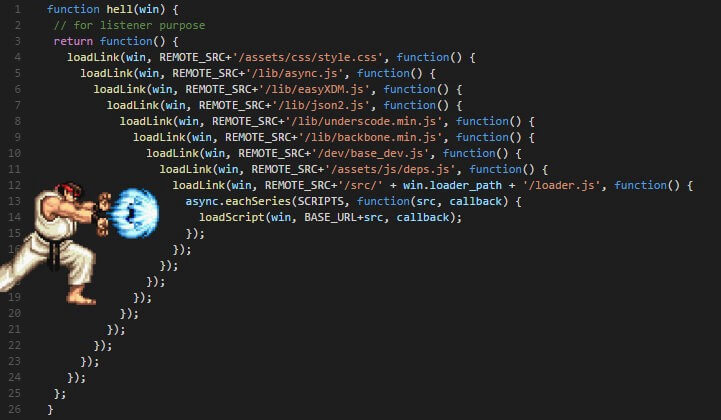
    I think this image says it all about what is callback hell, and why it’s named so.

    How to fix : fortunately there’s been tons of solutions against this :

    • Promises : it’s a real game changer because you can easily see the flow of your app. You just chain “then”, passing the value from one callback to another, in a linear way. And you add a single .catch to handle whatever bad things could happen in the whole process
    • Async / Await : I said Promises were a game changer ? oh whoops. This one is the real deal. Now you don’t have any more then/catch, your code is just plain old imperative like it has always been, except you add async and await keywords here and there.
    • Generators : this is still an other way, kind of esoteric some would say, to handle side effects (because yeah, callbacks/promises/async await are really about handling concurrent operations, which are side effects). You might want to check out.

    Global Variables

    Yes, indeed, variables in Javascript are global whenever they can. And you know, Javascript is so cool, it doesn’t like to scream on you, so it let’s you do your mistakes and clean behind you. So, you can naively use a variable you didn’t ever declare, and it’s gonna be a global.

    function foo() {
        x = 10; // Whoops
    }
    foo();
    console.log(x); // 10

    If you are on the browser, it’s so well registered you can call it from the window object, like window.x .

    Why global variables are wrong ?

    • That’s some space allocated you’ll never get back until you nullify them explicitly by calling window.x = null
    • It induces sides effects in your functions that are going to use that, which makes the code way more complex to understand
    • Other people could as well have used this variable for a library or something (which isn’t rare for browser UI libs). Worst than that, one could inject malicious code in that global that would make your code crash or worst, leak informations.
    • It’s hard to test global variables, because they are global, and their usage is hard to determine.

    How to fix it : well, just never ever use them. There’s tons of way to get away without using global variables (such as closures and IIFE, i’ll talk about it in an other course). Always use let and const when you declare a variable, and if you’re not confident, use strict.

    Wrapping Up

    I think I didn’t even closely cover every bad things in JS and how to avoid them, but I want this list to be updated as much as possible, so please don’t hesitate to give some feedback, and subjects that I should cover. Thanks you !

    Through there’s a lot of bad things in JS, recall it has been made in, like, 2 weeks, in a hard and competitive climax. Hopefully we somehow managed to take something out of it, like a huge ecosystem, some interesting programming schemes, and we made a lot of great apps.


    每天推荐一个 GitHub 优质开源项目和一篇精选英文科技或编程文章原文,欢迎关注开源日报。交流QQ群:202790710;微博:https://weibo.com/openingsource;电报群 https://t.me/OpeningSourceOrg

  • 2018年9月24日:开源日报第200期

    24 9 月, 2018

    每天推荐一个 GitHub 优质开源项目和一篇精选英文科技或编程文章原文,欢迎关注开源日报。交流QQ群:202790710;微博:https://weibo.com/openingsource;电报群 https://t.me/OpeningSourceOrg


    今日推荐开源项目:《这个是200期的特别标题 vue-design》传送门:GitHub链接

    推荐理由:今天要介绍的是一个对 Vue.js 的源码进行分析的项目,所谓源码分析,就是讲清楚每一句代码的意思,毕竟既然写下来了,那么肯定那一行代码就有存在的意义。如果你对 Vue.js 的源码感兴趣,这个项目算是一个很好的选择,读源码是可以学到很多东西的,可能比你单纯的读一本技术书要来的更多。这个项目现在正在持续更新中,同时随着 Vue.js 本身的更新文章也会进行相应的改动,所以不用担心版本落后的问题。


    今日推荐英文原文:《6 simple CSS tricks for images》作者:Stephani Worts

    原文链接:https://www.godaddy.com/garage/6-simple-css-tricks-for-images/

    推荐理由:简单的 CSS 小技巧,在细节上为你的图片加分

    6 simple CSS tricks for images

    When it comes to web design, images are vital. Paragraph after paragraph of content and no graphics or photos to break it up looks incredibly boring. However, there are a few behind-the-scenes CSS tricks you can employ to help your images stand out from the crowd. Ranging from that-looks-cool to downright-practical, these six CSS tricks should be in every developer’s playbook.

    Think outside the box

    Move beyond the world of plain boxy images with the 3 B’s — box-shadow, borders and border-radius.

    Use the box-shadow property to add a soft drop-shadow effect to an image or graphic button.

    img {
      box-shadow: 8px 8px 10px #aaa;
    }

    The first two numbers specify the horizontal and vertical shadow positions, respectively. The third number sets the blur (higher numbers = fuzzier). Not used in our example is an optional fourth value that specifies the spread (size) of the shadow. The final value allows you to set the color of your shadow effect.

    Pro tip: Shadows should be subtle and used to accentuate graphics or images. Don’t go too overboard or you’ll instead make it more difficult for visitors to look at your site.

    If you want to set an image apart but a shadow isn’t quite the right effect, consider a border. While borders are typically thought of as solid lines of a set thickness, CSS actually offers quite a few other options.

    img {
      border: 10px double red;
    }

    First, we specify the thickness of the border. The second property defines the type of border; this can be solid, or it could be dashed, dotted, double, groove, ridge, inset or outset. The best way to see the differences is simply to experiment with various values. In this case, we get a double red border around the image:

    To take it further, you can use border in conjunction with padding to create a framed effect. If we use a setting of

    Img {
       border: 15px solid #3e2b14;
      padding: 10px;
    }

    … you see a “frame” around our photo:

    If you really want to break away from the boxed-look, then the border-radius property is for you. With this setting, you can create everything from slightly-rounded corners to full-on circular images with nothing but CSS.

    This property can take values in a number of different ways, so it’s best to check out the this tutorial for more information. In our example, the corners are all set to the same value with a single number. The first image shows slightly rounded corners, while the second shows a full-round, or circular, image.

    img {
      border-radius: 30px;  // partially rounded corners
    }
     
    img {
      border-radius: 100%; // full circular image
    }

    Things aren’t always what they seem

    Perhaps you want to show an image but have it “fade” more into the background. In this instance, the opacity setting can be useful. The first is the image as-is; in the second, the image is set at half opacity (0.5). Opacity values range from 0-1, with 1 being “full strength.”

    img {
      opacity: 0.5;
    }

    With a little extra preparation in your code, you can achieve a variety of additional visual tricks. In this example, we’ve set the image as the background to a <div> element instead of a simple <img> tag. Now, a linear-gradient can be applied to the element to create some neat effects.

    Here is the base CSS for the source <div>:

    .imageDiv {
       background: url(“images/rust.png”);
       height: 700px;
    }

    Typically in a linear gradient, two different colors are specified to create a fade effect. But if you use the same color in both places, you can create a photo-filter effect. You could darken the image…

    .imageDiv {
      background-image:
    	linear-gradient(
      	rgba(0, 0, 0, 0.5),
      	rgba(0, 0, 0, 0.5)
    	),
       background: url(“images/rust.png”);
    }

    …or create a color wash effect.

    .imageDiv {
      background-image:
    	linear-gradient(
      	rgba(255, 0, 0, 0.5),
      	rgba(255, 0, 0, 0.5)
    	),
       background: url(“images/rust.png”);
    }

    Let CSS do the heavy lifting

    Wanting to dig a little deeper? Consider using image sprites. This handy little technique is great for small images or icons (such as social media links or navigation arrows). It combines a single combination image file and CSS for positioning to decrease load times for frequently accessed graphics. With a sprite, the image is loaded once and used multiple places throughout the website. The portion of the image that is seen by the user is controlled with CSS positioning.

    Sprites can greatly increase your website’s speed by decreasing the number of requests made to the server.


    There are many tutorials on using image sprites, including this one from Tutorial Republic, if you are interested in trying out the technique. You can also learn more about CSS sprites in this post.


    每天推荐一个 GitHub 优质开源项目和一篇精选英文科技或编程文章原文,欢迎关注开源日报。交流QQ群:202790710;微博:https://weibo.com/openingsource;电报群 https://t.me/OpeningSourceOrg

  • 2018年9月23日:开源日报第199期

    23 9 月, 2018

    每天推荐一个 GitHub 优质开源项目和一篇精选英文科技或编程文章原文,欢迎关注开源日报。交流QQ群:202790710;微博:https://weibo.com/openingsource;电报群 https://t.me/OpeningSourceOrg


    今日推荐开源项目:《复制粘贴回车一气呵成 TinyEditor》传送门:GitHub链接

    推荐理由:今天我们来讲编辑器,JSCSSHTML 最小的编辑器是什么?Tiny。TinyEditor,坐。整个大小不到 400 kb,JSCSSHTML 一应俱全,要启动的话复制粘贴回车一气呵成按下即可启动,是编辑器中的豪杰。


    今日推荐英文原文:《11 Javascript Data Visualization Libraries for 2018》作者:Jonathan Saring

    原文链接:https://blog.bitsrc.io/11-javascript-charts-and-data-visualization-libraries-for-2018-f01a283a5727

    推荐理由:JS 数据可视化库,如果你以为它们只是图表就大错特错了,其中有一些看起来就非常酷炫的……高级图表和不是图表的其他玩意,如果想要用更酷炫的方法展示数据的话可以考虑看看这个

    11 Javascript Data Visualization Libraries for 2018

    We live in an era of data explosion, when nearly every application we develop uses or leverages data to improve the experience delivered to the users.

    Sometimes, the best feature we can deliver to our users is the data itself. However, table and number charts are often tiring to read and it can be hard to draw actionable insights from large data tables.

    Instead, we can use neat data visualization methods that leverage the brain’s ability to identify and process data in a visual way. To help you get started and easily add beautiful data visualization to your favorite application, here are some of the best Javascript data visualization libraries around in 2018 (unranked). Feel free to comment and add your own suggestions and insights!

    Tip: We use some of these libraries for various applications, using Bit (GitHub) to share and sync reusable components in different apps and project. Feel free to try these libraries with or without Bit for yourself.

    Bit – Share and build with code components
    Bit helps you share, discover and use code components between projects and applications to build new features and…bitsrc.io

    1. D3js

    At 80k stars D3.js is probably the most popular and extensive Javascript data visualization library out there. D3 is built for manipulating documents based on data and bring data to life using HTML, SVG, and CSS. D3’s emphasis on web standards gives you the capabilities of modern browsers without coupling to a proprietary framework, combining visualization components and a data-driven approach to DOM manipulation. It allows you to bind arbitrary data to a Document Object Model (DOM), and then apply data-driven transformations to the document. Here’s a great example gallery.

    Note: some say D3 isn’t a data visualization library at all… 🙂

    2. ChartJS

    An extremely popular (40k stars) library of open source HTML 5 charts for responsive web applications using the canvas element. V.2 provides mixed chart-types, new chart axis types, and beautiful animations. Designs are simple and elegant with 8 basic chart types, and you can combine the library with moment.js for time axis. You can also check out the library on cdnjs.

    3. ThreeJS

    This incredibly popular library (45K stars; 1K contributors) in built for creating 3d animations using WebGL. The project’s flexible and abstract nature means it’s also useful for visualizing data in 2 or 3 dimensions. For example You can also use this designated module for 3D graph visualization with WebGL, or try this online playground. Interesting choice to consider.

    mrdoob/three.js
    JavaScript 3D library. Contribute to mrdoob/three.js development by creating an account on GitHub.github.com

    4. Echarts & Highcharts

    Example gif from this neat medium post

    Baidu’s Echarts project (30k stars) is an interactive charting and visualization library for the browser. It’s written in pure JavaScript and is based on the zrender canvas library. It supports rendering charts in the form of Canvas, SVG (4.0+), and VML In addition to PC and mobile browsers, ECharts can also be used with node-canvas on node for efficient server-side rendering (SSR). Here’s a link to the full example gallery, where each example can be played with (and themed) in an interactive playground.

    apache/incubator-echarts
    A powerful, interactive charting and visualization library for browser – apache/incubator-echartsgithub.com

    Highcharts JS is a 8K stars and widely popular JavaScript charting library based on SVG, with fallbacks to VML and canvas for old browsers. It claims to eb used by 72 out of the world’s 100 largest companies, which makes it (probably) the most popular JS charting API in the world (Facebook, Twitter).

    highcharts/highcharts
    Highcharts JS, the JavaScript charting framework. Contribute to highcharts/highcharts development by creating an…github.com

    5. Metric-Graphics

    MetricsGraphics.js (7k stars) is a library optimized for visualizing and laying out time-series data. It’s relatively small (80kb minified), and provides a narrow yet elegant selection of line charts, scatterplots, histograms, bar charts and data tables, as well as features like rug plots and basic linear regression. Here’s a link to an interactive example gallery.

    metricsgraphics/metrics-graphics
    metrics-graphics – A library optimized for concise and principled data graphics and layouts.github.com

    6. Recharts

    Recharts is a chart library build with React and D3 that lets you deploy as declarative React components. The library provides native SVG support, lightweight dependency tree (D3 submodules) is highly customizable via component props. You can find live examples in the docs website.

    recharts/recharts
    Redefined chart library built with React and D3. Contribute to recharts/recharts development by creating an account on…github.com

    7. Raphael

    A 10k stars Javascript “vector library” for working with vector graphics in the web. The library uses the SVG W3C Recommendation and VML as a base for creating graphics, so every graphical object is also a DOM object and you can attach JavaScript event handlers. Raphaël currently supports Firefox 3.0+, Safari 3.0+, Chrome 5.0+, Opera 9.5+ and Internet Explorer 6.0+.

    DmitryBaranovskiy/raphael
    raphael – JavaScript Vector Librarygithub.com

    7. C3js

    C3 combination chart

    At 8k stars C3 is a D3-based reusable chart library for web applications. The library provides classes to every element so you can define a custom style by the class and extend the structure directly by D3. It also provides a variety of APIs and callbacks to access the state of the chart. By using them, you can update the chart even after it’s rendered. Take a look at these examples.

    c3js/c3
    bar_chart: A D3-based reusable chart library. Contribute to c3js/c3 development by creating an account on GitHub.github.com

    8. React Virtualized + React Vis + Victory

    React-vis (4k stars) is Uber’s set of React components for visualizing data in a consistent way, including line/area/bar charts, heat maps, scatterplots, contour plots, hexagon heatmaps and much more. The library does not require any previous knowledge with D3 or any other data-vis library, and provides low-level modular building-block components such as X/Y axis. A great match for working with Bit and a very useful library to consider.

    uber/react-vis
    react-vis — Data-Visualization oriented componentsgithub.com

    React virtualized (12k stars) is a set of React components for efficiently rendering large lists and tabular data. ES6, CommonJS, and UMD builds are available with each distribution and the project supports a Webpack 4 workflow. Note that react, react-dom must be specified as peer dependencies in order to avoid version conflicts. Give it a try.

    bvaughn/react-virtualized
    react-virtualized – React components for efficiently rendering large lists and tabular datagithub.com

    Victory is a collection of React composable React components for building interactive data visualization, built by Formidable Labs and with over 6k stars. Victory uses the same API for web and React Native applications for easy cross-platform charting. An elegant and flexible way to leverage React components in favor of practical data visualization. I like it.

    These libraries is a neat combination with Bit when using individual components, to share and sync them across apps.

    9. CartoDB

    At 2k stars Carto is a Location Intelligence & Data Visualization tool for discovering insights underlying location data. You can upload geospatial data (Shapefiles, GeoJSON, etc) using a web form and visualize it in a dataset or on a map, search it using SQL, and apply map styles using CartoCSS. Here are a bunch of video demos to help you get the idea and get started.

    CartoDB/cartodb
    cartodb – Location Intelligence & Data Visualization toolgithub.com

    10. Raw graphs

    At over 5K stars Raw is a connection link between spreadsheets and data visualization built to create custom vector-based visualizations on top of the d3.js library. It works with tabular data (spreadhseets and comma-separated values) as well as with copied-and-pasted texts from other applications. Based on the SVG format, visualizations can be edited with vector graphics applications for further refinements, or directly embedded into web pages. Here’s an example gallery to explore before diving in.

    densitydesign/raw
    raw – The missing link between spreadsheets and data visualizationgithub.com

    11. Metabase

    At over 11k stars Metabase is a rather quick and simple way to create data dashboards without knowing SQL (but with SQL Mode for analysts and data pros). You can create canonical segments and metrics, send data to Slack (and view data in Slack with MetaBot) and more. Probably a great tool to visualize data internally for your team, although some maintenance might be required.

    metabase/metabase
    metabase – The simplest, fastest way to get business intelligence and analytics to everyone in your company :yum:github.com

    Bonus: tauCharts

    At nearly 2k stars tauCharts is a D3-based and data-focused charting library. The library provides a declarative interface for fast mapping of data fields to visual properties, and its architecture allows you to build facets and extend chart behavior with reusable plugins. It also looks pretty good, right?

    TargetProcess/tauCharts
    D3 based data-focused charting library. Designed with passion. Flexible. – TargetProcess/tauChartsgithub.com

    Honorable mentions

    Note that some of these are unmaintained.

    gionkunz/chartist-js
    Simple responsive charts. Contribute to gionkunz/chartist-js development by creating an account on GitHub.github.com
    emeeks/semiotic
    semiotic – A data visualization framework combining React & D3github.com
    novus/nvd3
    A reusable charting library written in d3.js. Contribute to novus/nvd3 development by creating an account on GitHub.github.com
    viserjs/viser
    viser is a toolkit fit for data vis engineer.github.com
    nhnent/tui.chart
    tui.chart – ?? Beautiful chart for data visualization.github.com
    markmarkoh/datamaps
    datamaps – Customizable SVG map visualizations for the web in a single Javascript file using D3.jsgithub.com
    jlord/sheetsee.js
    sheetsee.js – :eyes: :chart_with_upwards_trend: Visualize Data from a Google Spreadsheetgithub.com
    alibaba/BizCharts
    BizCharts – data visualization library based G2 and Reactgithub.com
    jacomyal/sigma.js
    sigma.js – A JavaScript library dedicated to graph drawinggithub.com
    apache/incubator-echarts
    incubator-echarts – A powerful, interactive charting and visualization library for browsergithub.com
    almende/vis
    vis.js is a dynamic, browser-based visualization librarygithub.com

    Learn More

    11 React UI Component Libraries You Should Know In 2018
    11 React component libraries with great components for building your next app’s UI interface in 2018.blog.bitsrc.io
    Understanding Execution Context and Execution Stack in Javascript
    Understanding execution context and stack to become a better Javascript developer.blog.bitsrc.io
    5 Tools For Faster Development In React
    5 tools to speed the development of your React application, focusing on components.blog.bitsrc.io

    每天推荐一个 GitHub 优质开源项目和一篇精选英文科技或编程文章原文,欢迎关注开源日报。交流QQ群:202790710;微博:https://weibo.com/openingsource;电报群 https://t.me/OpeningSourceOrg

  • 2018年9月22日:开源日报第198期

    22 9 月, 2018

    每天推荐一个 GitHub 优质开源项目和一篇精选英文科技或编程文章原文,欢迎关注开源日报。交流QQ群:202790710;微博:https://weibo.com/openingsource;电报群 https://t.me/OpeningSourceOrg


    今日推荐开源项目:《20 CP 的情报解析 Dumper.js》传送门:GitHub链接

    推荐理由:这个项目是为 Node.js 应用准备的变量解析器,只需要直接调用函数然后把想要解析的变量写进去,它就会输出这个变量的情报,在调试的时候有了这个在有些时候会方便不少。

    大概这么多情报:


    今日推荐英文原文:《The 12 Things You Need to Consider When Evaluating Any New JavaScript Library》作者:Sacha Greif

    原文链接:https://medium.freecodecamp.org/the-12-things-you-need-to-consider-when-evaluating-any-new-javascript-library-3908c4ed3f49

    推荐理由:从12个方面来评估一个新的 JS 库,从而知道这玩意值不值得去用

    The 12 Things You Need to Consider When Evaluating Any New JavaScript Library

    How do you know if a new technology is worth investing time into?

    For this year’s State of JavaScript survey I wanted to dig a little bit deeper, and not only know which tools and libraries people were using, but also why they were using them.

    Which means I had to find a way to translate personal preferences into cold, hard data. After some research, I came up with a 12-point scale that covers the main aspects of picking and working with any technology.

    Take the Quiz!

    To make it easier for you to apply the scale to any library, I prepared a quick quiz that will take you through all 12 factors and give you a final recommendation:

    ➡️ Take the 12-Factor Quiz

    If you’re not sure what to evaluate, just do it on a library you’re familiar with (React, Vue, jQuery…) and see how well it scores!

    Or, you can read on to find out more about each factor, and see how they can be applied.

    Note: About The State of JavaScript Survey

    Like I mentioned, I originally developed this scale as a way to get more granular data for the annual State of JavaScript survey.

    If you’d like to contribute and help identify the latest trends in the JavaScript ecosystem, go take the survey!

    Now back to the 12-point scale.

    The Factors

    Here’s the full list:

    1. ?️ Features
    2. ? Stability
    3. ⚡ Performance
    4. ? Package Ecosystem
    5. ? Community
    6. ? Learning Curve
    7. ? Documentation
    8. ? Tooling
    9. ?️ Track Record
    10. ? Team
    11. ⚖️ Compatibility
    12. ? Momentum

    I’ll explain the importance of each factor, and also give you a scoring grid to show you how to evaluate it. Let’s go through the list!

    ?️ Features

    The first reason why you’d pick any technology is likely for what it does.

    But the key question here is knowing how far to go. React is probably the most popular front-end library out there right now, but a common complaint is that it just doesn’t do enough, leaving things like routing and state management to third-party libraries like React-Router and Redux.

    In fact, this is a big part of the appeal of Vue, React’s biggest competitor. By providing official packages for these common use cases, it’s managed to offer a more well-rounded solution and gain a lot of ground.

    Then again, take this too far and you might end up with a bloated, complex framework that tries to be everything to everyone.

    So sometimes, a minimalist approach is what’s needed. Libraries like Lodash or Ramda let you replace your messy nested for loops with terse functional expressions, and that’s enough to make them invaluable tools.

    Again, it’s all about finding the right equilibrium!

    Scoring System

    • A: Unlocks things that were just not possible before.
    • B: Lets you do the same things as before, but in a better way.
    • C: Does less than current solutions.

    ? Stability

    You can have the most elegant, full-featured framework ever, but it won’t amount to much if developers run into errors every two minutes.

    For that reason, a lot of tools in the current JavaScript ecosystem focus on adding stability and security to the stack. Look no further than TypeScript and Flow’s successes, or even languages like Reason.

    And on the data layer side, GraphQL’s type system also contributes to making sure everything runs smoothly.

    Scoring System

    • A: Fewer bugs, and issues become easier to debug and solve.
    • B: Adopting the technology does not have an impact on your software’s stability.
    • C: New bugs and issues arise as a direct consequence of adopting the technology.

    ⚡ Performance

    If you’ve ever trained martial arts, you’ll know that one of the best possible attributes you can have on your side is speed, not strength.

    Similarly, all the features in the world are no use if it takes your app 15 seconds to load. By that time, the user has already closed the tab and you’ve lost the fight before it even begun!

    In the JavaScript ecosystem, look no further than Preact to see an example of focusing on speed: its API is identical to React, so it’s not trying to compete on feature strength. But by being lighter-weight and faster to load than React, it lets you save precious milliseconds and improve your webapp’s performance.

    Scoring System

    • A: Lighter bundle, faster load times, or other performance improvements.
    • B: Adopting the technology does not have an impact on your software’s performance.
    • C: Adopting the technology slows down your app measurably.

    ? Package Ecosystem

    Before investing in any new technology, it’s important to look at the ecosystem that has developed around it.

    Not only is a vibrant package ecosystem a huge time-saver since it lets you piggy-back on the work of others, but it’s also a sign that the technology has reached a certain maturity level. For that reason, well-maintained third-party packages are one of the best possible signs that developers have embraced a technology for the long run.

    Scoring System

    • A: Ecosystem has unambiguous solutions for common concerns; third-party packages are well-maintained and well-documented.
    • B: Budding package ecosystem with many competing new options.
    • C: No package ecosystem to speak of, lots of manual work required.

    ? Community

    Another factor to consider is the overall community. A dedicated forum or Slack channel can be a huge help when running into issues.

    Spectrum is an increasingly popular middle ground between chatrooms and traditional forums.

    It’s also helpful to have an existing repository of Stack Overflow answers to look up. And of course, a well-maintained GitHub issues page is a must!

    Scoring System

    • A: Forum and/or chatroom (Slack/Discord/etc.) with daily activity, GitHub issues addressed within a day. Many answered Stack Overflow questions.
    • B: Forum and/or chatroom with infrequent activity.
    • C: No community beyond GitHub.

    ? Learning Curve

    An easy learning curve makes it much more likely that developers will give your framework or library a shot. It’s tempting to think that if a technology is truly disruptive people will push through any obstacle, but it’s often just not true.

    A closely related (yet sometimes opposite) concept is the “adoption” curve. When it first launched, Meteor was extremely easy to use (at least compared to existing alternatives) but it required you to adopt its entire stack at once, making it very hard to implement for existing projects.

    React is also famous for its rough learning curve: for developers used to separating HTML and JavaScript, having to use JSX can be tough. Vue on the other hand makes it a lot easier to get started without having to rethink the way you think about front-end coding as much.

    Scoring System

    • A: Possible to get started in a single day.
    • B: About a week required before becoming productive.
    • C: More than a week required to learn the basics.

    ? Documentation

    A big part of an easy learning curve is having great documentation. This is harder to achieve than it sounds, as the people writing the documentation are usually the ones with the most experience; meaning they’re also furthest removed from the new developer experience.

    So writing good documentation requires forgetting what you know for a second and putting yourself in the shoes of someone just discovering your technology.

    Vue.js’ documentation is both well-designed and well-written.

    It also requires anticipating common issues, understanding the user’s mental model, and most of all keeping everything up to date as your codebase changes! And all of that takes precious time away from actual coding…

    Given all these factors, you can understand why good documentation is a rare and valuable thing!

    Scoring System

    • A: Dedicated documentation site, screencasts, example projects, tutorials, API documentation, and well-commented code.
    • B: Basic Read Me and API documentation.
    • C: Very succinct Read Me, the only way to know how to use the library is to look at its code.

    ? Tooling

    Just like documentation, tooling is one of these things that may seem like a secondary distraction to some maintainers, but is actually vital to the popularity and success of any technology.

    Redux’s DevTools alone make it worth considering.

    I believe a big reason behind Redux’ success is its amazing Devtools browser extension, which lets you visualize the Redux store and actions in a very user-friendly way. Similarly, VS Code’s great TypeScript support has done wonders for its adoption.

    Scoring System

    • A: Two or more of: browser extensions, text editor extensions, CLI utility, dedicated third-party SaaS services.
    • B: One of: browser extensions, text editor extensions, CLI utility, dedicated third-party SaaS services.
    • C: No external tooling.

    ?️ Track Record

    At the end of the day, even the most elegant, best-documented library out there will be easily dismissed as nothing more than a flash in the pan if it’s only been around for six months.

    We can all recount stories of adopting the “next big thing”, only to come crawling back to good old Rails/PHP/*insert tried-and-true technology here* when things start to go bad.

    Express: still a contender even after all these years

    For that reason, nothing can beat a solid track record. Express is one of the examples around: it was originally released in 2010, yet is still considered the default Node.js server framework despite the JavaScript ecosystem’s fast-moving pace.

    Scoring System

    • A: Has been around for 4+ years, adopted my major companies and well-known tech consultancies.
    • B: Has been around for 1–4 years, used by early adopters and smaller-scale consultancies.
    • C: Has been around for less than a year, no real adoption yet.

    ? Team

    Not all projects have an existing track record. When a library is brand new, how do you judge its potential? One reliable way it to look at who’s behind it.

    When React first came out, the fact that none other than Facebook was behind it was a big argument to at least try it out. Facebook then went on to release Relay and GraphQL, showing that React’s success wasn’t a fluke!

    Google Open Source: over 2000 projects covering desktop, mobile, and more.

    And larger companies also have more resources to invest: Google has been able to continue maintaining the original Angular.js even after releasing newer, incompatible versions.

    Of course this doesn’t mean lone maintainers can’t also create major innovations. This is how Vue.js was born after all, to say nothing of 99% of all open-source software out there.

    Scoring System

    • A: Maintained by a major company with a dedicated open-source team.
    • B: Maintained by a medium-sized team of engineers with solid individual track records.
    • C: Lone maintainer working independently.

    ⚖️ Compatibility

    The great thing about adopting cutting-edge libraries is that they usually evolve quite fast. Sadly, that can also be a major downside!

    A fast improvement rate can also mean frequent breaking changes as new best practices replace old patterns, leaving early adopters to pay the refactoring costs.

    React Router generated a lot of gripes when they decided to completely change their API between versions 3 and 4. And so did Angular when they made the switch from Angular.js to the new “just Angular”.

    Frequent updates are fun and exciting when you’re just starting out a new project, but once your app is up and running in production the last thing you want is having to spend weeks of refactoring and debugging every time a new version of a library comes out.

    Scoring System

    • A: Updates are mostly backwards-compatible, deprecations are handled with warnings, and incompatible older versions are maintained for two years or more.
    • B: Breaking changes do happen but are well documented and are rolled out gradually.
    • C: Frequent breaking updates requiring major refactoring without the proper guidance.

    ? Momentum

    Last but not least, momentum. In other words, hype.

    Hype is often seen as a bad thing (“don’t fall victim to the hype”), as an indicator of style over substance. But it doesn’t always have to be.

    With enough momentum, a new software project can attract more users and more contributors, which means bugs are found and fixed faster, a package ecosystem can develop, and everybody ultimately ends up better off.

    JavaScript Rising Stars, our project charting the growth of popular JavaScript libraries

    But yes, there’s also the other side of the coin: too much hype too early can expose potential users to an unfinished version riddled with issues, turning them off for good. Like they say, you only get one chance at making a first impression.

    Scoring System

    • A: Hype Level Over 9000: top of Hacker News, thousands of GitHub stars, talks at major conferences.
    • B: Some interest around the initial launch, hundreds of GitHub stars.
    • C: Lone developer toiling away in obscurity. One day I’ll show them! I’ll show them all!!

    Update: A Few More Factors

    Some of you suggested a few more great factors to look at. Something to consider for a potential version 2.0 of the scale!

    • Scalability: how well does the technology work for large projects.
    • Adoption: who else is using the technology currently?
    • Compatibility: how well does the technology work with other existing techs?
    • Decoupling: how easy is it to migrate out of the technology if you want to stop using it?

    Case Study: Apollo Client

    Let’s put our scoring system to the test by applying it on an actual, real-world library: Apollo Client.

    Apollo Client

    Apollo is a GraphQL client, in other words it’s a library that will query a GraphQL endpoint and load its data on the client for you. It also handles things like caching, making sure data is not duplicated, and sending said data to your front-end library of choice.

    Let’s see how it does on our scoring system!

    ?️ Features: B

    Apollo gives you better ways to query data, so it’s more of a gradual improvement over existing tools.

    ? Stability: A

    Adopting Apollo and GraphQL does make it easier to reason about your data and track down issues.

    ⚡ Performance: B

    Apollo does include tools to optimize your data loading, but overall should not have an outsized impact on your app’s performance either way.

    ? Package Ecosystem: A

    Apollo supports packages called links in order to enable extra features.

    ? Community: B

    Apollo does have a very active Slack chatroom, but in my experience questions can sometimes go unanswered and it can be hard to get replies from busy core team members.

    ? Learning Curve: B

    Learning all the nuances of Apollo can actually be a challenge, especially if you’re learning to use GraphQL at the same time.

    ? Documentation: A

    Good, well-maintained documentation provided for multiple front-end frameworks, as well as example codebases.

    ? Tooling: A

    Browser extension and a dedicated metrics platform.

    ?️ Track Record: B

    Apollo itself is still fairly new, but so is the GraphQL space in general.

    ? Team: A

    Highly competent and well-funded team with experience launching other open-source projects (Meteor).

    ⚖️ Stability: B

    Breaking update from v1 to v2, but overall good stability and backwards compatibility since.

    ? Momentum: B

    Apollo may not be a household name yet, but it’s the dominant player in its niche despite Relay’s head start.


    Overall Grade: A ?

    With 29 points out of a maximum of 36, Apollo ends up doing really well! Even if there will always be areas for improvement, it’s easy to see why it’s been adopted in production by many teams who need a reliable way to deal with GraphQL data.

    Other Approaches

    The folks at NPMS have implemented a similar rating system, automated from looking at GitHub and NPM data. This makes their scoring less subjective, but no the other hand it doesn’t cover things like documentation or community.

    On the raw data side, you can also get some cool stats with NPM Trends:

    NPM Trends

    And learn more about which libraries are currently popular on Best of JS:

    Best of JS

    And of course, there’s always last year’s State of JS survey results:

    The State of JavaScript 2017 survey results

    What about you, how do you usually evaluate libraries? Leave a comment to let me know!

    Conclusion

    This scale is by no means an absolute measure of a library’s worth. After all this will always be mostly subjective, and strongly depends on your project and your needs.

    Still, we’re hoping it can serve as a useful starting point. If nothing else, it can serve as a checklist to make sure you’re not overlooking anything important before making that big jump into the future!


    每天推荐一个 GitHub 优质开源项目和一篇精选英文科技或编程文章原文,欢迎关注开源日报。交流QQ群:202790710;微博:https://weibo.com/openingsource;电报群 https://t.me/OpeningSourceOrg

←上一页
1 … 209 210 211 212 213 … 262
下一页→

Proudly powered by WordPress